
计算工具系列 —— Pyprocar库
¡Hola a todos!
最近学习了一下Pyprocar的用法,分享一下使用心得。
对于老司机这种天生反骨的打工人,每天想的都是怎么偷懒,但是又想保住份工,就只能在效率上面想办法了,总之就是:
Be lazy, stay efficient, and enjoy your coffee break!
介绍
[官网](PyProcar — PyProcar 6.1.10 documentation (romerogroup.github.io) ):
PyProcar is a robust, open-source Python library used for pre- and post-processing of the electronic structure data coming from DFT calculations. PyProcar provides a set of functions that manage data from the PROCAR format obtained from various DFT codes. Basically, the PROCAR file is a projection of the Kohn-Sham states over atomic orbitals. That projection is performed to every 𝑘-point in the considered mesh, every energy band and every atom. PyProcar is capable of performing a multitude of tasks including plotting plain and spin/atom/orbital projected band structures and Fermi surfaces- both in 2D and 3D, Fermi velocity plots, unfolding bands of a super cell, comparing band structures from multiple DFT calculations, plotting partial density of states and generating a 𝑘-path for a given crystal structure.
简而言之,自动出图,解放双手。而且对比其他后处理软件,老司机个人感觉Pyprocar出的图相对来说已经比较好看了,作为工作狗来说妥妥够用不需要二次处理了;放在顶刊文章里可能还需要再编辑下,不过还好Pyprocar提供了matplotlib再处理的功能,所以对图片要求更加高大上的也不用担心,再次编辑就行了。
处理能带
能带VASP计算流程参照参照Learn VASP from pyamtgen系列——Chap.8 计算小白硬学VASP —— 材料性质计算—>能带计算 - A&H (andyhox.github.io),直接处理案例的数据。
Pyprocar后处理
普通能带
Pyprocar的代码非常简单,只需要简单设置就可以得到基本的能带图,主要用到的方法为pyprocar.bandsplot。
代码如下:
1 | import pyprocar |
运行代码:
首先调用pymatgen会输出gap信息:
{‘direct’: False, ‘energy’: 0.5058999999999987, ‘transition’: ‘GAMMA-X’}
结构为间接半导体,VBM→CBM方向为:GAMMA→X,禁带宽度为:0.5 eV
默认参数输出的能带图:
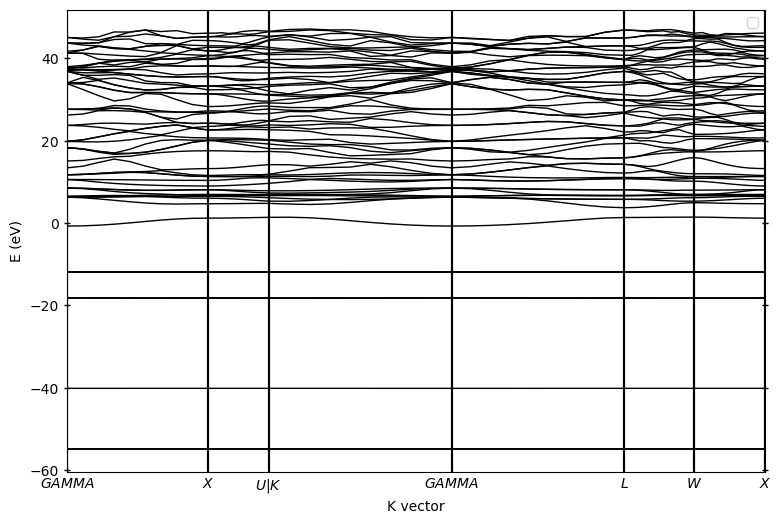
ok,此时的能带图初见轮廓但是不利于分析。默认参数下没有平移费米能级至0,已经选择合适的energy interval,所以我们需要优化一下:
1 | import pyprocar |
运行:
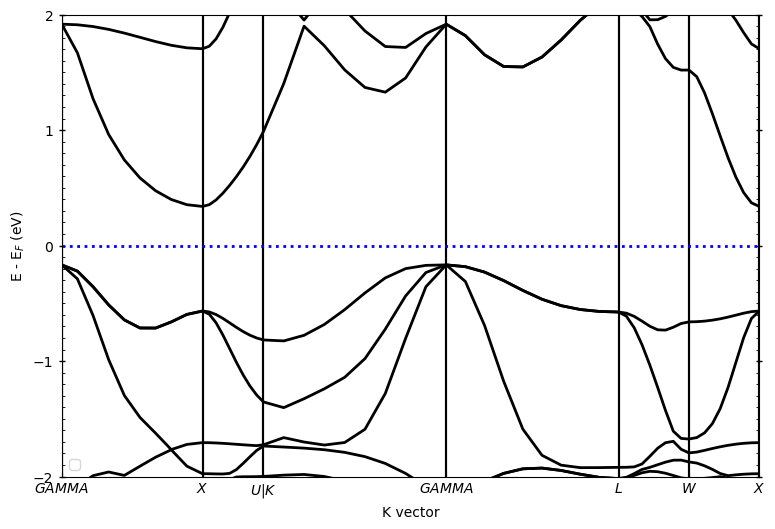
针对上述图片,我们增加了源参数:
elimit:控制纵坐标能量范围;fermi:提供费米能级
源参数即pyprocar.bandsplot读取后输出对应的图,具体参数即含义可[参考文档](PyProcar — PyProcar 6.1.10 documentation (romerogroup.github.io) )。参数有很多,但是实际操作中只需要设置几个参数就可以得到非常好的图了。
绘图参数是在此基础上调整图片的线宽,字体大小等,同样也只需要设置有限个参数就可以得到很好的图片了。
绘图参数
spin_colors : {‘description’: ‘The colors for the plot lines.’, ‘value’: [‘blue’, ‘red’]}
color : {‘description’: ‘The colors for the plot lines.’, ‘value’: ‘black’}
colorbar_title : {‘description’: ‘Title of the colorbar.’, ‘value’: ‘Atomic Orbital Projections’}
colorbar_title_size : {‘description’: ‘Font size of the title of the colorbar.’, ‘value’: 15}
colorbar_title_padding : {‘description’: ‘Padding of the title of the colorbar.’, ‘value’: 20}
colorbar_tick_labelsize : {‘description’: ‘Size of the title of the colorbar ticks’, ‘value’: 10}
cmap : {‘description’: ‘The colormap used for the plot.’, ‘value’: ‘jet’}
clim : {‘description’: ‘The color scale for the color bar’, ‘value’: [None, None]}
fermi_color : {‘description’: ‘The color of the Fermi line.’, ‘value’: ‘blue’}
fermi_linestyle : {‘description’: ‘The linestyle of the Fermi line.’, ‘value’: ‘dotted’}
fermi_linewidth : {‘description’: ‘The linewidth of the Fermi line.’, ‘value’: 1}
grid : {‘description’: ‘If true, a grid will be shown on the plot.’, ‘value’: False}
grid_axis : {‘description’: ‘Which axis (or both) the grid lines should be drawn on.’, ‘value’: ‘both’}
grid_color : {‘description’: ‘The color of the grid lines.’, ‘value’: ‘grey’}
grid_linestyle : {‘description’: ‘The linestyle of the grid lines.’, ‘value’: ‘solid’}
grid_linewidth : {‘description’: ‘The linewidth of the grid lines.’, ‘value’: 1}
grid_which : {‘description’: ‘Which grid lines to draw (major, minor or both).’, ‘value’: ‘major’}
label : {‘description’: ‘The labels for the plot lines.’, ‘value’: [‘
’, ‘ ’]} legend : {‘description’: ‘If true, a legend will be shown on the plot.’, ‘value’: True}
linestyle : {‘description’: ‘The linestyles for the plot lines.’, ‘value’: [‘solid’, ‘dashed’]}
linewidth : {‘description’: ‘The linewidths for the plot lines.’, ‘value’: [1.0, 1.0]}
marker : {‘description’: ‘The marker styles for the plot points.’, ‘value’: [‘o’, ‘v’, ‘^’, ‘D’]}
markersize : {‘description’: ‘The size of the markers for the plot points.’, ‘value’: [0.2, 0.2]}
opacity : {‘description’: ‘The opacities for the plot lines.’, ‘value’: [1.0, 1.0]}
plot_color_bar : {‘description’: ‘If true, a color bar will be shown on the plot.’, ‘value’: True}
savefig : {‘description’: ‘The file name to save the figure. If null, the figure will not be saved.’, ‘value’: None}
title : {‘description’: ‘The title for the plot. If null, no title will be displayed.’, ‘value’: None}
weighted_color : {‘description’: ‘If true, the color of the lines will be weighted.’, ‘value’: True}
weighted_width : {‘description’: ‘If true, the width of the lines will be weighted.’, ‘value’: False}
figure_size : {‘description’: ‘The size of the figure (width, height) in inches.’, ‘value’: [9, 6]}
dpi : {‘description’: “The resolution in dots per inch. If ‘figure’, use the figure’s dpi value.”, ‘value’: ‘figure’}
轨道投影能带图
线性
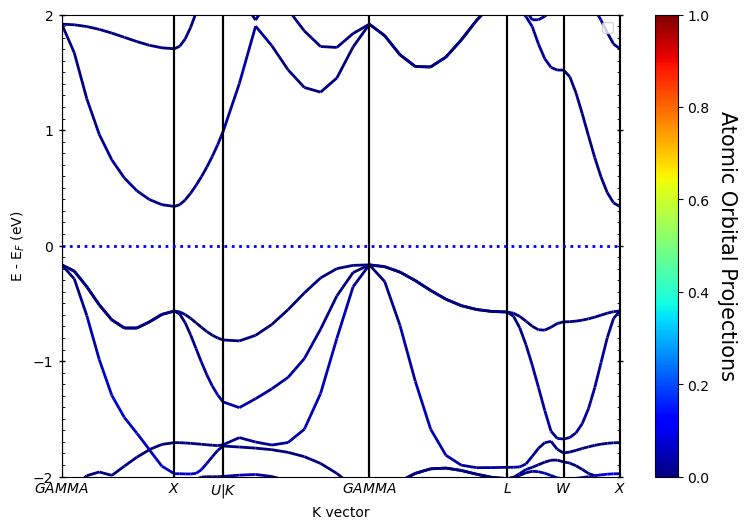
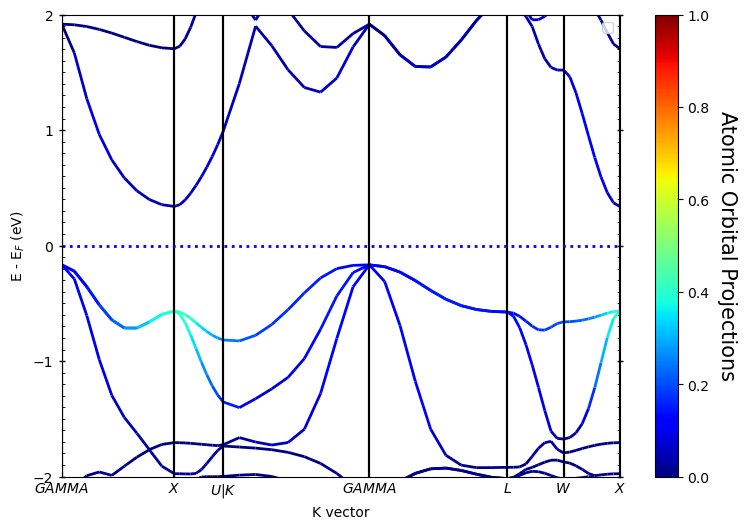
LORBIT设置成12的话,轨道的分类如下:

此时pyprocar.bandsplot中设置mode=parametric,同时也需要指定轨道:
orbitals=[1]:只分析py亚轨道;orbitals=[1,2,3]:分析全部p轨道;- 以此类推……
下面为primtive_cell的结果:
1 | import pyprocar |
运行代码:
1 | import pyprocar |
运行代码:
1 | import pyprocar |
运行代码:
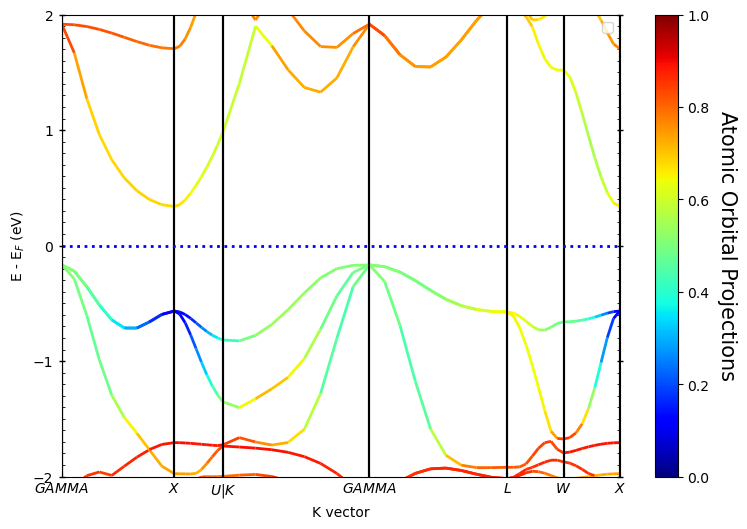
如果是对于自旋体系,在源参数中增加spins即可控制绘图考虑的自旋方向:
spins=[0]:绘制spin upspins=[1]:绘制spin downspins=[0,1]:同时绘制spin up & spin down
老司机这里计算的时候把自旋关了,所以输出也就只有一条,不用额外设置。
除此之外,还可以输出原子的贡献,操作就是把oribitals换成atoms,如下:
1 | import pyprocar |
运行代码:
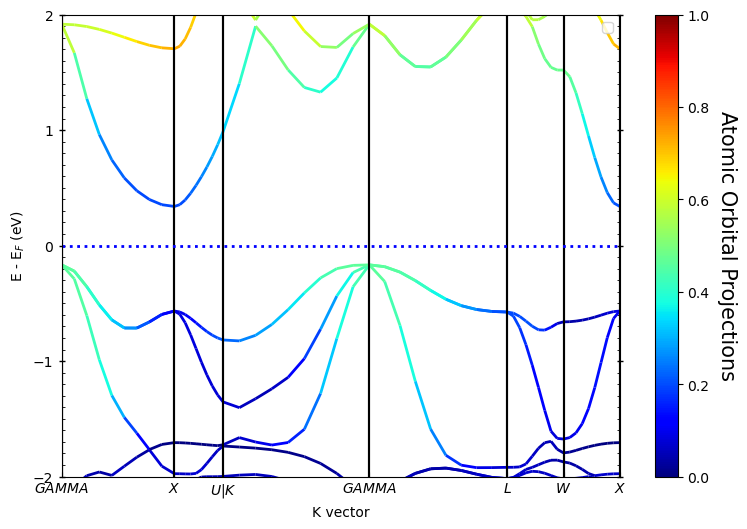
如果想得到某一元素的贡献,只需要在atoms=[]中包含同一元素原子所有的序号即可,上面计算用到的primtive cell中每个元素只有一个原子,即上图为Zr元素的贡献。
散点
还可以用散点来表示,差别只是把mode='parametric‘换成mode='scatter',其余设置一样,如下:
1 | import pyprocar |
运行代码:
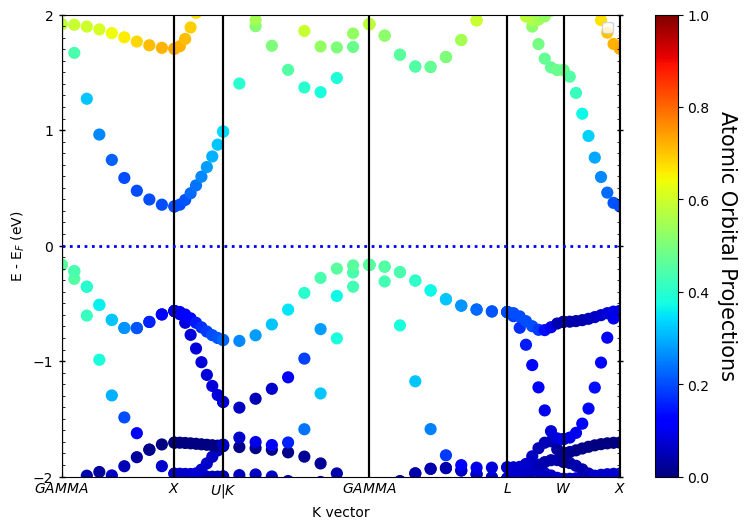
处理态密度
态密度的处理方法与能带类似,使用pyprocar.dosplot,VASP计算流程参照Learn VASP from pyamtgen系列——Chap.5 计算小白硬学VASP —— 材料性质计算—>态密度 - A&H (andyhox.github.io)。
直接接着后处理上文ZrNiSn结构的态密度。
Pyrocar 后处理
总态密度TDOS
代码如下:
1 | import pyprocar |
运行代码:
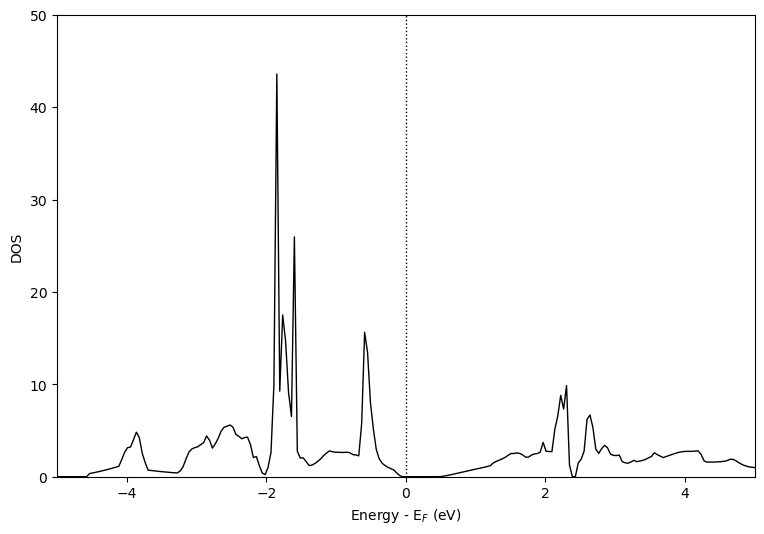
上述案例没有考虑ISPIN,故只显示一个方向。
分态密度PDOS
指定元素和轨道
这里可以绘制ZrNiSn中Zr-d、Ni-d、Sn-sp轨道,此时用到mode=overlay,同时也需要设置items指定元素及轨道。代码如下:
1 | import pyprocar |
运行代码:
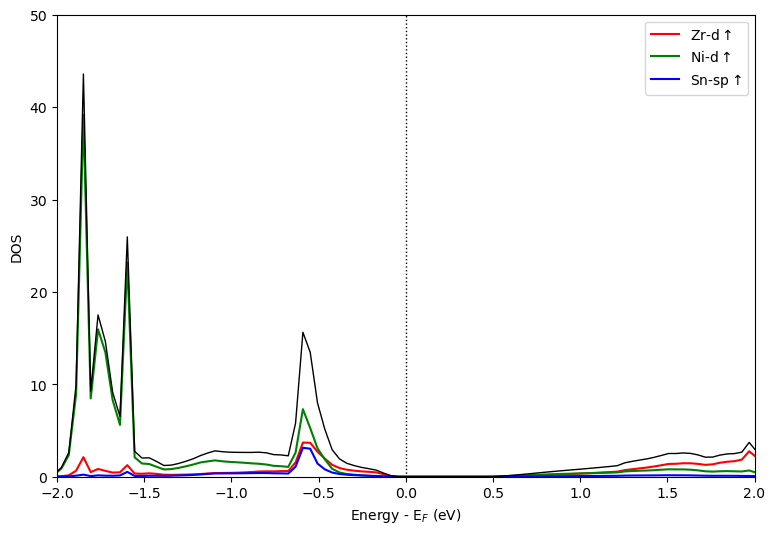
分析指定原子的PDOS
如果需要分析指定编号单个原子或多个原子的PDOS,可以采用mode=overlay_orbitals方法,此时只需要指定atoms对应的原子序号列表,如这里分析Zr+Ni的PDOS。代码如下:
1 | import pyprocar |
运行代码:
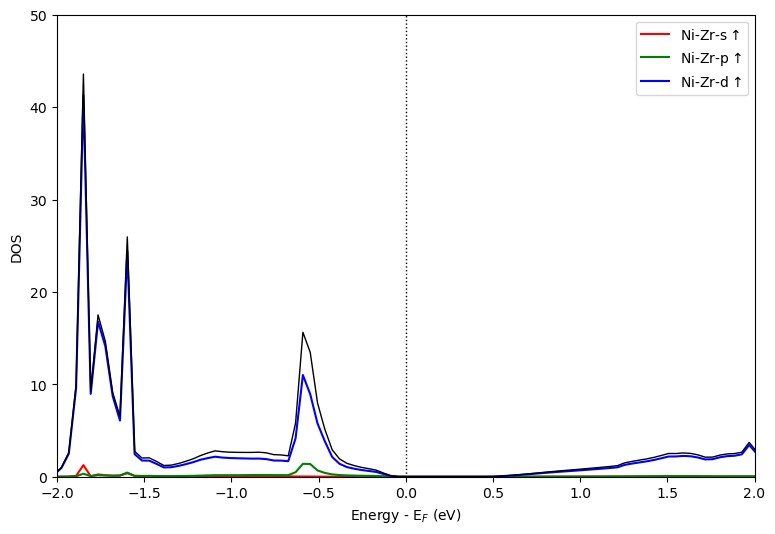
指定所有元素同一个轨道
如果对于给定的体系需要分析所有元素的同一个轨道,比如过渡金属高熵合金只看d轨道的话,可以采用mode=overlay_species,且只需要指定orbitals即可。代码如下:
1 | import pyprocar |
运行代码:
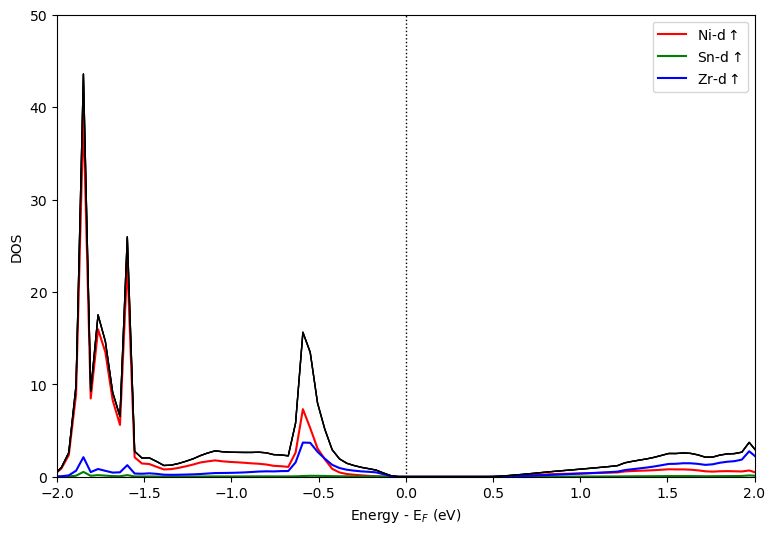
初次之外,图片还可以垂直的方式输出,只需要添加orientation='vertical',如上述代码改为垂直输出:
1 | import pyprocar |
运行代码:
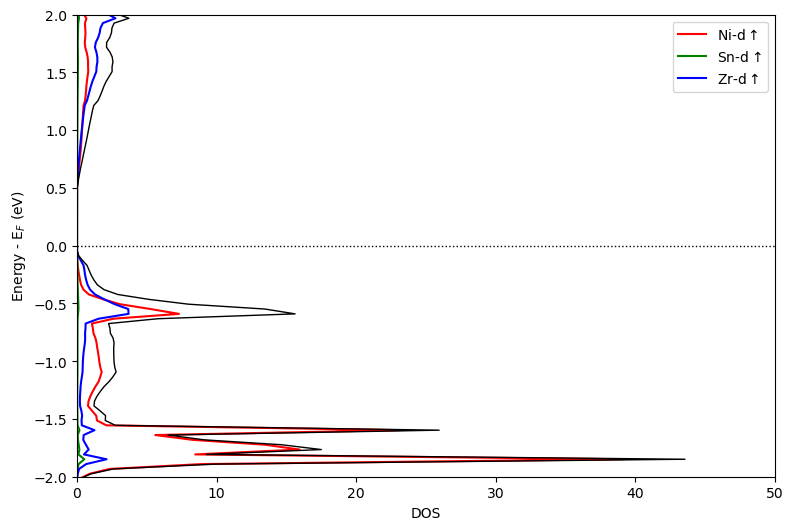
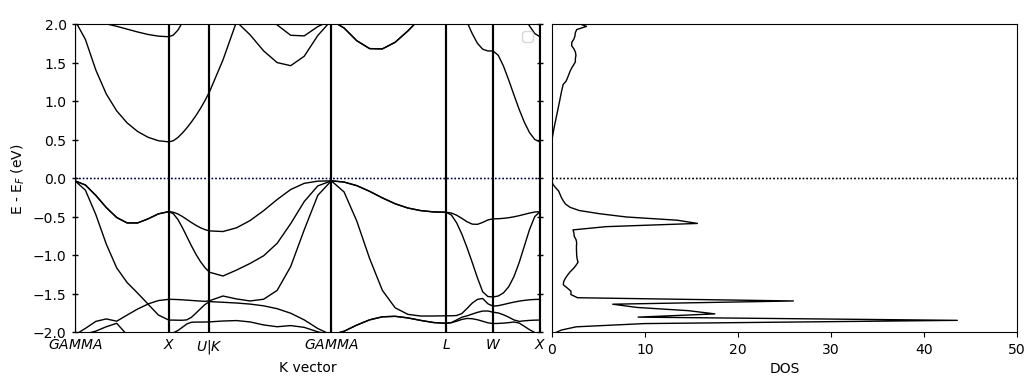
同时绘制能带态密度
用到pyprocar.bandsdosplot方法,只需要分别设置band和dos的参数,然后用bandsdosplot组合在一起即可,代码如下:
1 | import pyprocar |
运行代码:
总结
Pyprocar的用法就介绍到这,欢迎补充!
¡Muchas gracias!
- 标题: 计算工具系列 —— Pyprocar库
- 作者: 炫酷老司机
- 创建于 : 2024-06-20 00:00:00
- 更新于 : 2024-06-27 09:31:00
- 链接: https://andyhox.github.io/2024/06/20/Pyprocar-tutorial-1/
- 版权声明: 欢迎个人转载、使用、转贴等,但请获得作者同意且注明出处!