Chap.9 计算小白硬学VASP —— 材料性质计算—>能带分析
¡Hola a todos!
本章介绍如何分析能带计算结果。
导出gap/CBM/VBM信息 能带计算完后,直接读取vasprun.xml文件,可以最快的得到禁带宽度、CBM/VBM的数值,以及半导体种类(直接带隙/间接带隙)。代码如下:
1
2
3
4
5
6
7
8
9
10
11
12
13
14
15
from pymatgen.io.vasp.outputs import Vasprunimport pandas as pdvasprun = Vasprun("../ZrNiSn_primitive/band/vasprun.xml" ) bandgap_dict = vasprun.get_band_structure().get_band_gap() vbm = vasprun.get_band_structure().get_vbm()["energy" ] cbm = vasprun.get_band_structure().get_cbm()["energy" ] bandgap = pd.DataFrame([bandgap_dict]) bandgap["VBM" ] = vbm bandgap["CBM" ] = cbm print (bandgap)
运行代码可输出如下表格的信息:
direct
energy
transition
VBM
CBM
False
0.5059
GAMMA-X
8.489
8.9949
从左至右分别为:是否为直接带隙、禁带宽度、VBM/CBM指向、VBM能量、CBM能量。
还可以用BandStructure类同样可以得到类似信息:
1
2
3
4
5
6
7
8
9
from pymatgen.io.vasp.outputs import Vasprunfrom pymatgen.electronic_structure.bandstructure import BandStructurevasprun = Vasprun("../ZrNiSn_primitive/band/vasprun.xml" ) band = BandStructure.from_dict(vasprun.get_band_structure().as_dict()) print (band.get_band_gap())
导出能量本征值 还可以直接得到每条能带的能量本征值:
1
2
3
4
5
6
7
8
9
10
11
12
13
14
from pymatgen.io.vasp.outputs import Vasprunfrom pymatgen.electronic_structure.bandstructure import BandStructurefrom pymatgen.electronic_structure.core import Spin, Orbitalimport pandas as pdvasprun = Vasprun("../ZrNiSn_primitive/band/vasprun.xml" ) band = BandStructure.from_dict(vasprun.get_band_structure().as_dict()) eigenvalues = pd.DataFrame(band.bands[Spin.up]) print (eigenvalues)eigenvalues.to_csv("eigenvalues.csv" )
得到的数据格式索引符合[band_index, kpoint_index]。
导出完整的能带数据 除了一些特殊的需求,最重要的还是想要得到能带图,那么下面提供的代码就可以用来得到源数据用于绘图:
1
2
3
4
5
6
7
8
9
10
11
12
13
14
15
16
17
18
19
20
21
22
23
24
25
26
27
28
29
30
31
32
33
34
35
36
37
38
39
40
41
42
43
44
45
46
47
48
from pymatgen.io.vasp import Vasprunfrom pymatgen.electronic_structure.core import Spinimport pandas as pdvasprun = Vasprun("../ZrNiSn_primitive/band/vasprun.xml" ) band_structure = vasprun.get_band_structure(line_mode=True ) kpoints = band_structure.kpoints selected_spin = Spin.up energies = band_structure.bands[selected_spin] fermi_level = band_structure.efermi data = [] for band_index, band in enumerate (energies): for kpoint_index, energy in enumerate (band): if kpoint_index < len (kpoints): kpoint_coords = kpoints[kpoint_index].frac_coords kpoint_label = kpoints[kpoint_index].label kpoint_distance = band_structure.distance[kpoint_index] if kpoint_label: kpoint_info = kpoint_label else : kpoint_info = ',' .join(map (str , kpoint_coords)) data.append({ "spin" : selected_spin.name, "kpoint" : kpoint_info, "kpoint distance" : kpoint_distance, "band index" : band_index, "energy (eV)" : energy - fermi_level }) df = pd.DataFrame(data) csv_filename = f"band_structure_data_spin_{selected_spin.name} .csv" df.to_csv(csv_filename, index=False )
运行代码可以得到如下格式的csv文件:
spin
kpoints
kpoints distance
band index
energy(eV)
up
GAMMA
0
0
-63.5333
up
…
…
…
…
up
…
…
…
…
从左至右分别为:自旋方向,K点坐标,K点距离,第几条能带,能量本征值。
绘图时采用第三列为x轴,第五列为y轴,最后对应的横坐标位置标注对应的高对称点即可。
matplotlib库绘图 根据上面得到的band_structure_data_spin_up.csv文件,我们可以用matplotlib库进行绘图,代码如下:
1
2
3
4
5
6
7
8
9
10
11
12
13
14
15
16
17
18
19
20
21
22
23
24
25
26
27
28
29
30
31
32
33
34
35
36
37
38
39
40
41
42
43
44
45
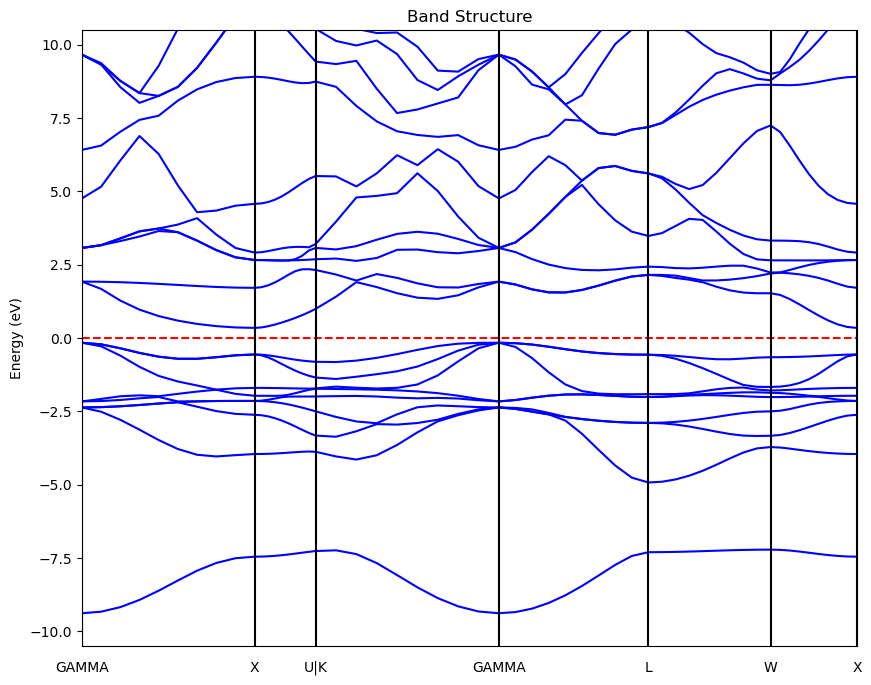
import pandas as pdimport matplotlib.pyplot as pltdf = pd.read_csv("band_structure_data_spin_up.csv" ) band_indices = df['band index' ].unique() plt.figure(figsize=(10 , 8 )) for band_index in band_indices: band_data = df[df['band index' ] == band_index] plt.plot(band_data['k-point distance' ], band_data['energy (eV)' ], color='blue' ) plt.ylabel('Energy (eV)' ) plt.title('Band Structure' ) plt.axhline(y=0 , color='r' , linestyle='--' ,) plt.ylim(-10.5 ,10.5 ) plt.xlim(df['k-point distance' ].min (), df['k-point distance' ].max ()) plt.xticks([]) high_symmetry_points = { 0 : "GAMMA" , 1.0245 : "X" , 1.387 : "U|K" , 2.473 : "GAMMA" , 3.36 : "L" , 4.085 : "W" , 4.597 : "X" } gap = -0.5 for position, point in high_symmetry_points.items(): plt.axvline(x=position, color='black' ) plt.text(position, plt.ylim()[0 ] + gap, point, verticalalignment='top' , horizontalalignment='center' ) plt.show()
运行代码:
该方法相对麻烦,不够自动化,还需要我们手动去提供高对称点参考线的字典,因此这里推荐另一种方法。
BSPlotter方法绘图 pymatgen有可以直接处理能带计算vasprun.xml文件的模块——pymatgen.electronic_structure.plotter.BSPlotter,直接绘制能带结果图。代码如下:
1
2
3
4
5
6
7
8
9
10
11
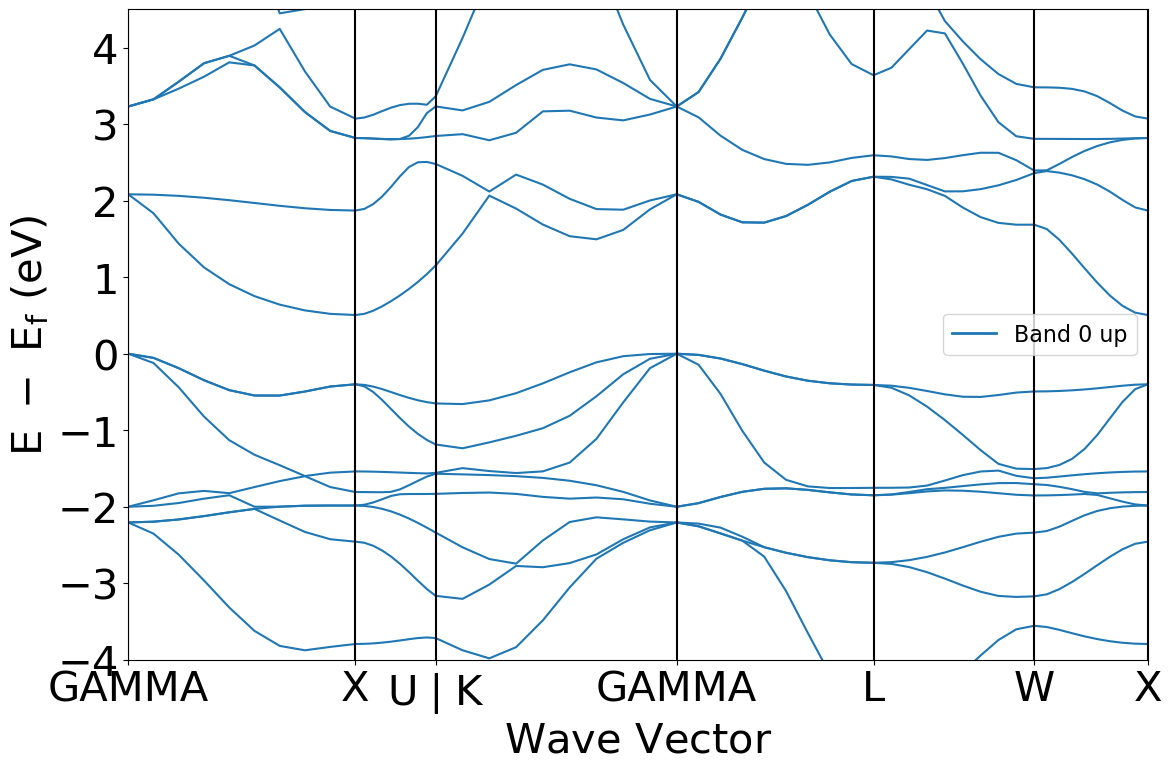
from pymatgen.electronic_structure.plotter import BSPlotterfrom pymatgen.io.vasp.outputs import Vasprunvasprun = Vasprun("../ZrNiSn_primitive/band/vasprun.xml" , parse_projected_eigen=True ) band = vasprun.get_band_structure(line_mode=True ) bs_plotter = BSPlotter(band) bs_plotter.get_plot()
运行代码:
BSPlotter使用起来非常方便,只需要读取相应的vasprun.xml文件即可,然而也有不足的地方,默认输出的图片格式不太美观,字体过大。这里我们可以在get_plot()方法之后,修改matplotlib的属性进行覆盖即可,代码如下:
1
2
3
4
5
6
7
8
9
10
11
12
13
14
15
16
17
18
19
20
21
22
23
24
25
26
27
28
29
30
31
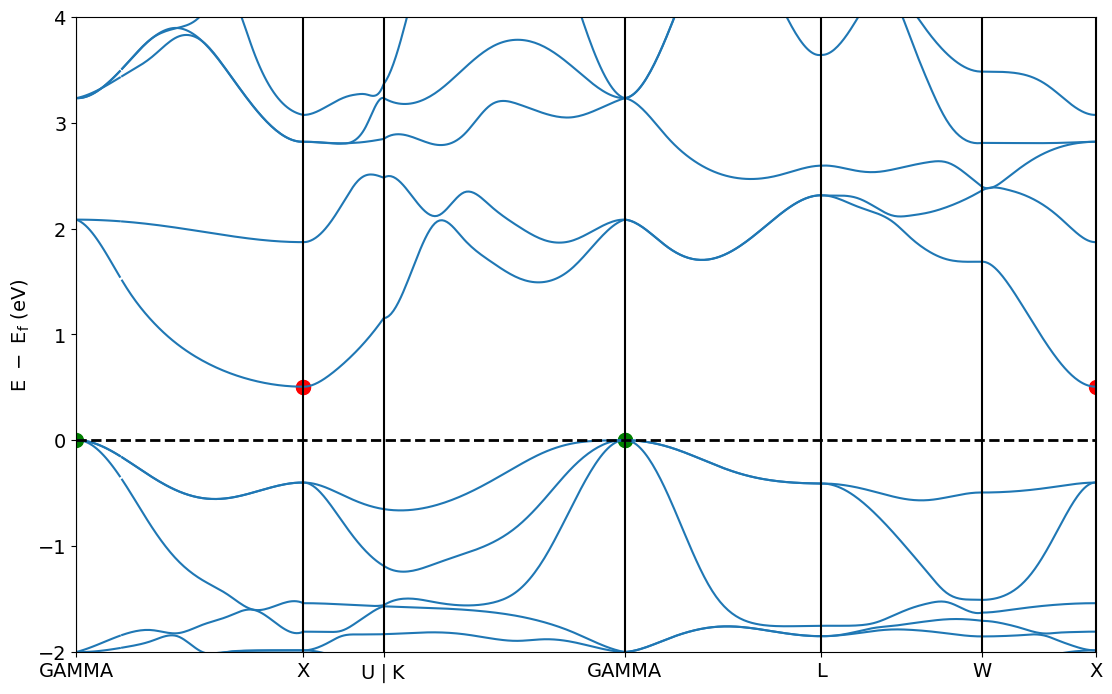
from pymatgen.electronic_structure.plotter import BSPlotterfrom pymatgen.io.vasp.outputs import Vasprunimport matplotlib.pyplot as pltvasprun = Vasprun("../ZrNiSn_primitive/band/vasprun.xml" , parse_projected_eigen=True ) band = vasprun.get_band_structure(line_mode=True ) bs_plotter = BSPlotter(band) ax = bs_plotter.get_plot(ylim=[-2 , 4 ], smooth=True , vbm_cbm_marker=True ) fontsize = 14 ax.set_xlabel(ax.get_xlabel(), fontsize=fontsize) ax.set_ylabel(ax.get_ylabel(), fontsize=fontsize) ax.tick_params(axis='both' , labelsize=fontsize) ax.axhline(y=0 , color='black' , linestyle='--' ,linewidth=2 ) legend = ax.get_legend() if legend is not None : legend.remove() ax.set_xlabel('' ) plt.show()
运行代码:
现在看上去就顺眼了很多。单独绘制能带图的话,还是推荐使用BSPlotter方法,然后再修改
matplotlib的属性来覆盖get_plot()方法中的默认参数。
¡Muchas gracias!


